Context · ObjectivesWhat is a Digital Twin?
A Digital Twin is a three-dimensional digital replica of a real-world environment, increasingly used in urban planning, infrastructure management, and academic research. While Nordic countries have systematically integrated such frameworks, Romania exhibits limited adoption — primarily due to financial constraints and restricted access to advanced geospatial infrastructure.
Key numbersMission at a glance
State of the artNordic Reference Frameworks
National initiatives systematically integrate UAV photogrammetry and SLAM LiDAR into urban planning, achieving fit-for-purpose accuracy of ≈ 2–5 cm.
Helsinki 3D+
City-scale digital twin · UAV photogrammetry + mobile mapping + SLAM handheld scanners.
Agisoft Metashape · CloudCompare · GIS
GeoDanmark
Distributed geospatial acquisition · GNSS RTK · DJI UAV · high-res RGB sensors.
Pix4Dmapper · Metashape · ArcGIS Pro
Lantmäteriet
Mobile LiDAR + UAV (Phantom, Matrice) · GNSS/IMU continuous capture along corridors.
SfM in Metashape · CloudCompare
Kartverket
National mapping authority · UAV + terrestrial LiDAR · open-data culture.
Standardized 2–5 cm urban accuracy
WorkflowIntegrated Multi-Sensor Methodology
01
Acquisition
Aerial UAV + Terrestrial SLAM
02
Processing
SfM/MVS in Metashape · SLAM optimization in FJD Trion Studio
03
Alignment
Coarse + ICP fine registration in CloudCompare
04
Digital Twin
Unified 3D model · LOD 200–300 · RMS < 3 cm
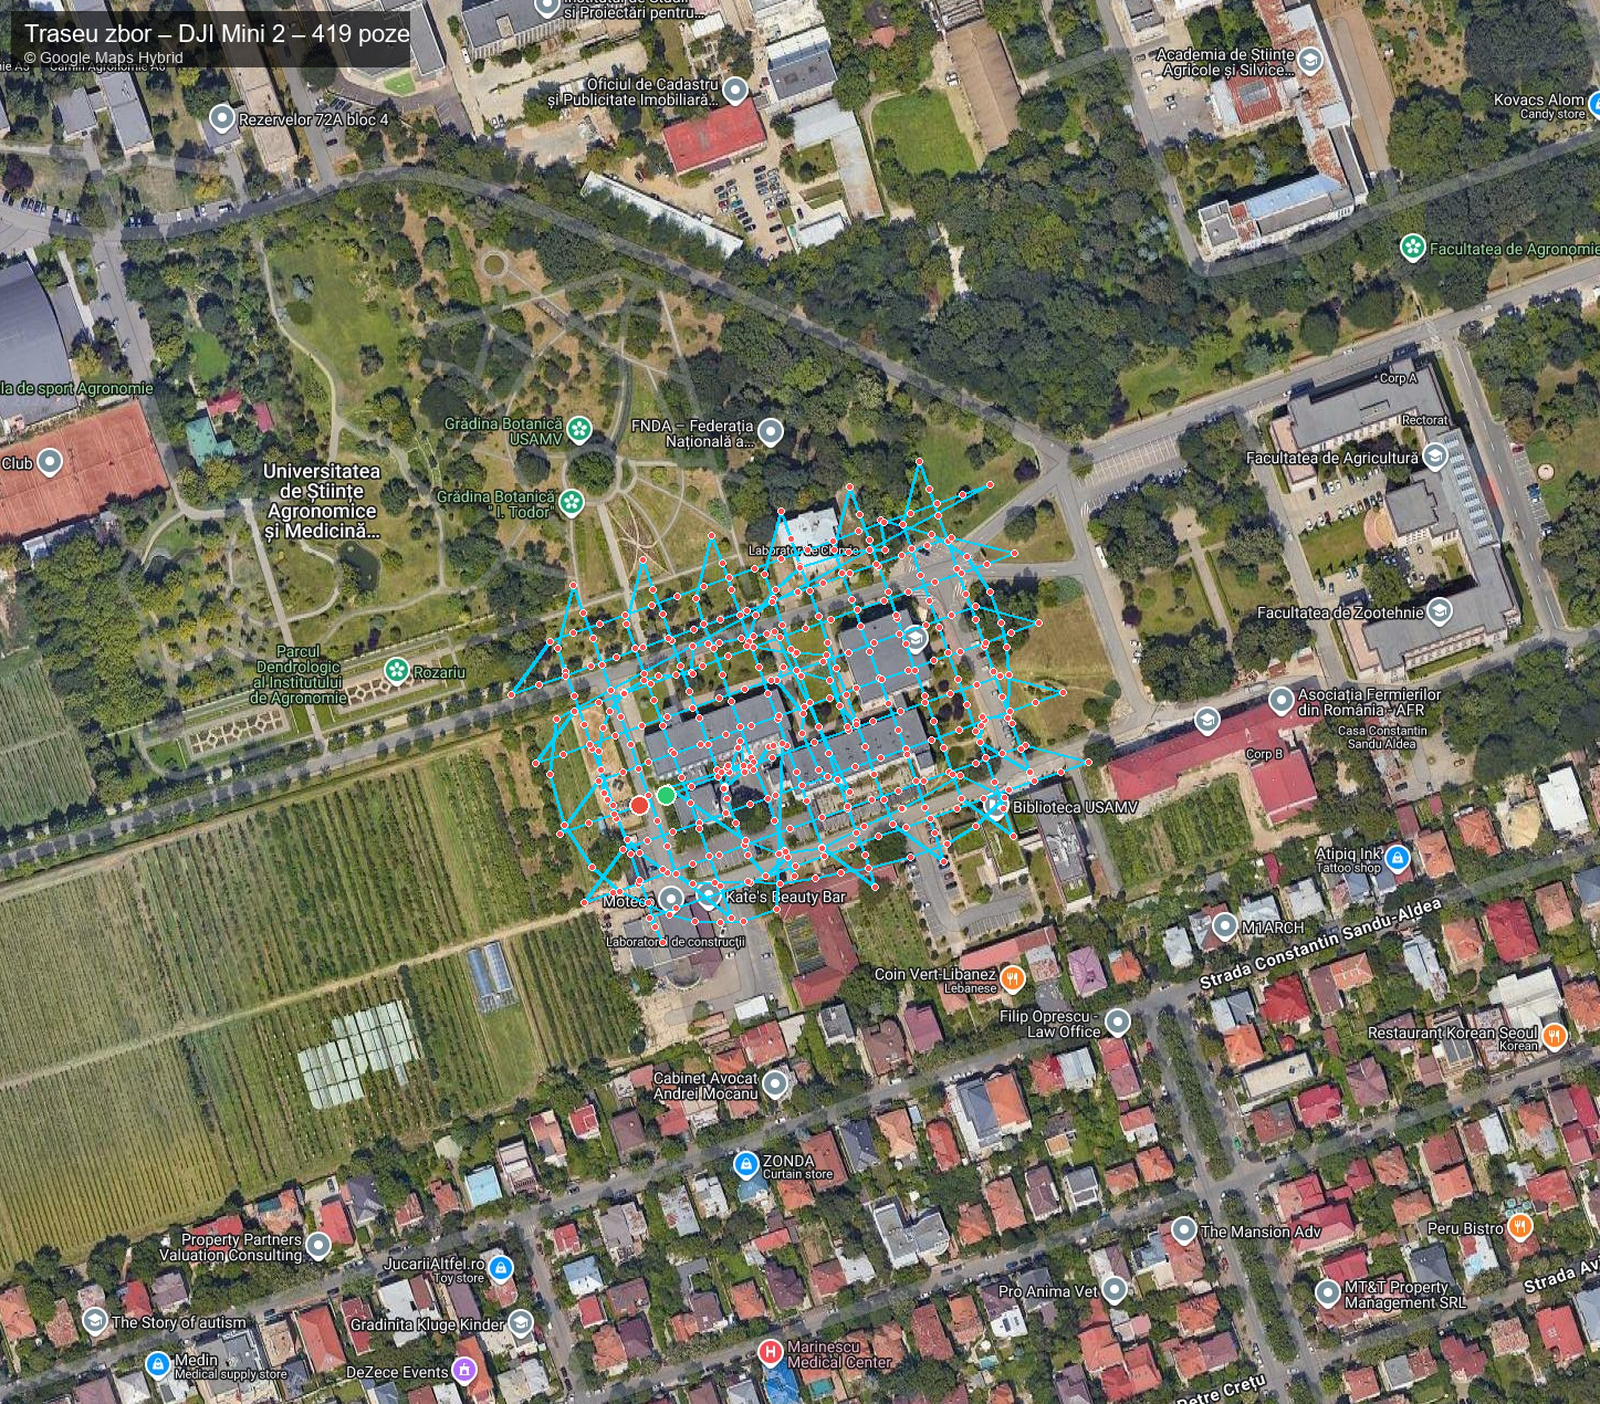
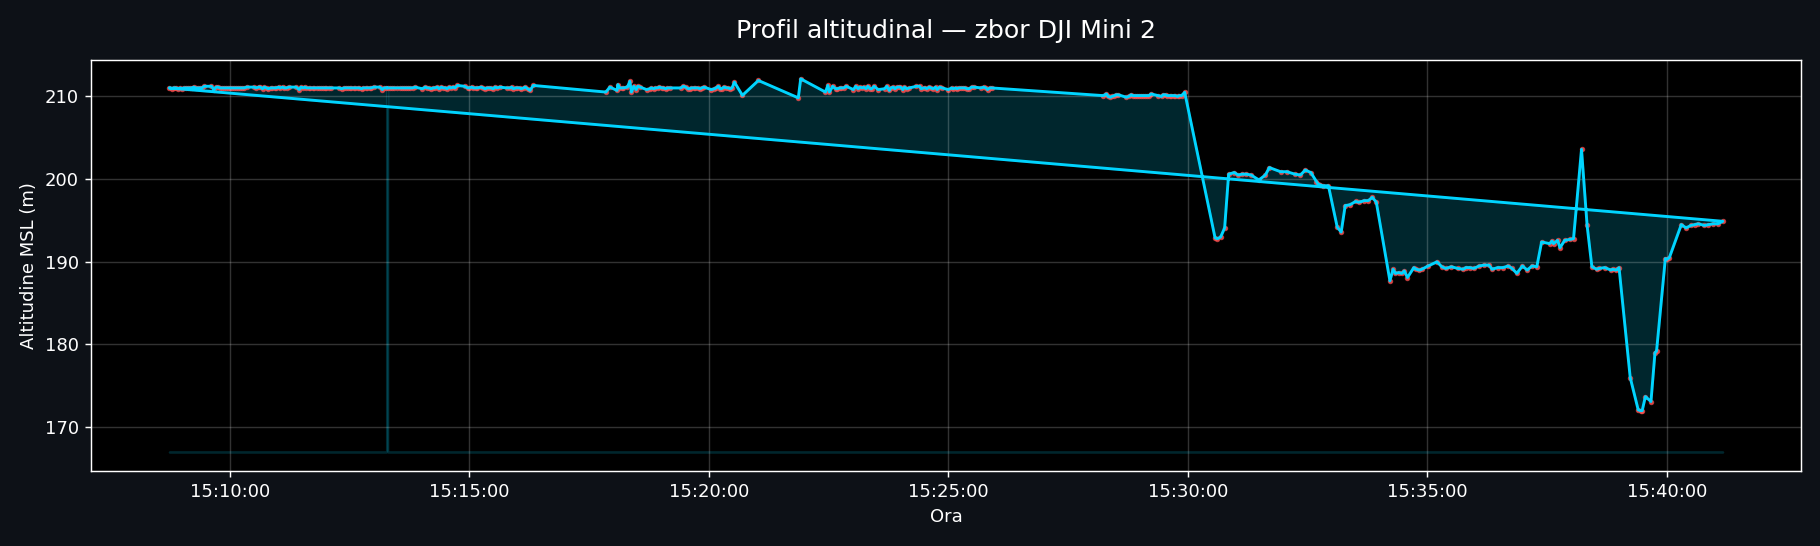
UAV PhotogrammetryAerial Acquisition — DJI Mini 2
Equipment specifications
| Weight | < 249 g |
| Camera | 12 MP · 4000 × 3000 px |
| Focal length | 4.49 mm (≈ 24 mm equiv.) |
| Aperture / ISO | f/2.8 · ISO 100 |
| Stabilization | 3-axis mechanical gimbal |
| Positioning | GNSS (GPS + GLONASS), no RTK/PPK |
| Geo-referencing | via Ground Control Points (GCPs) |
| Flight strategy | Nadir 30–50 m + oblique 45° |
| Image overlap | 70–80% forward & lateral |
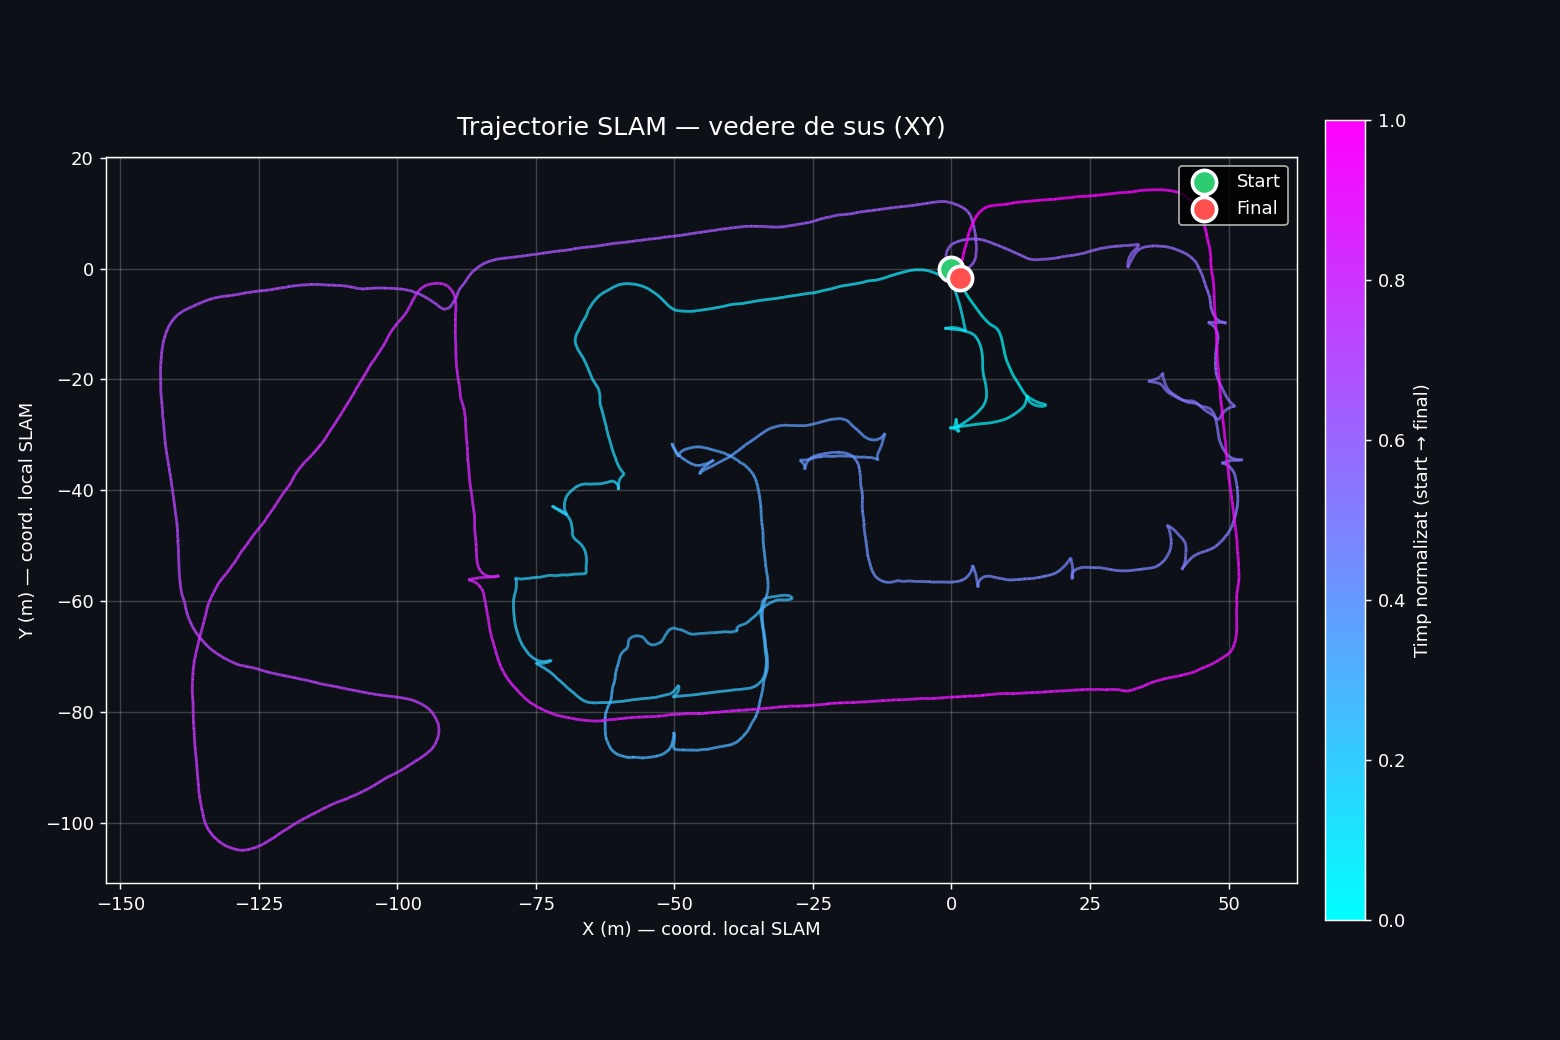
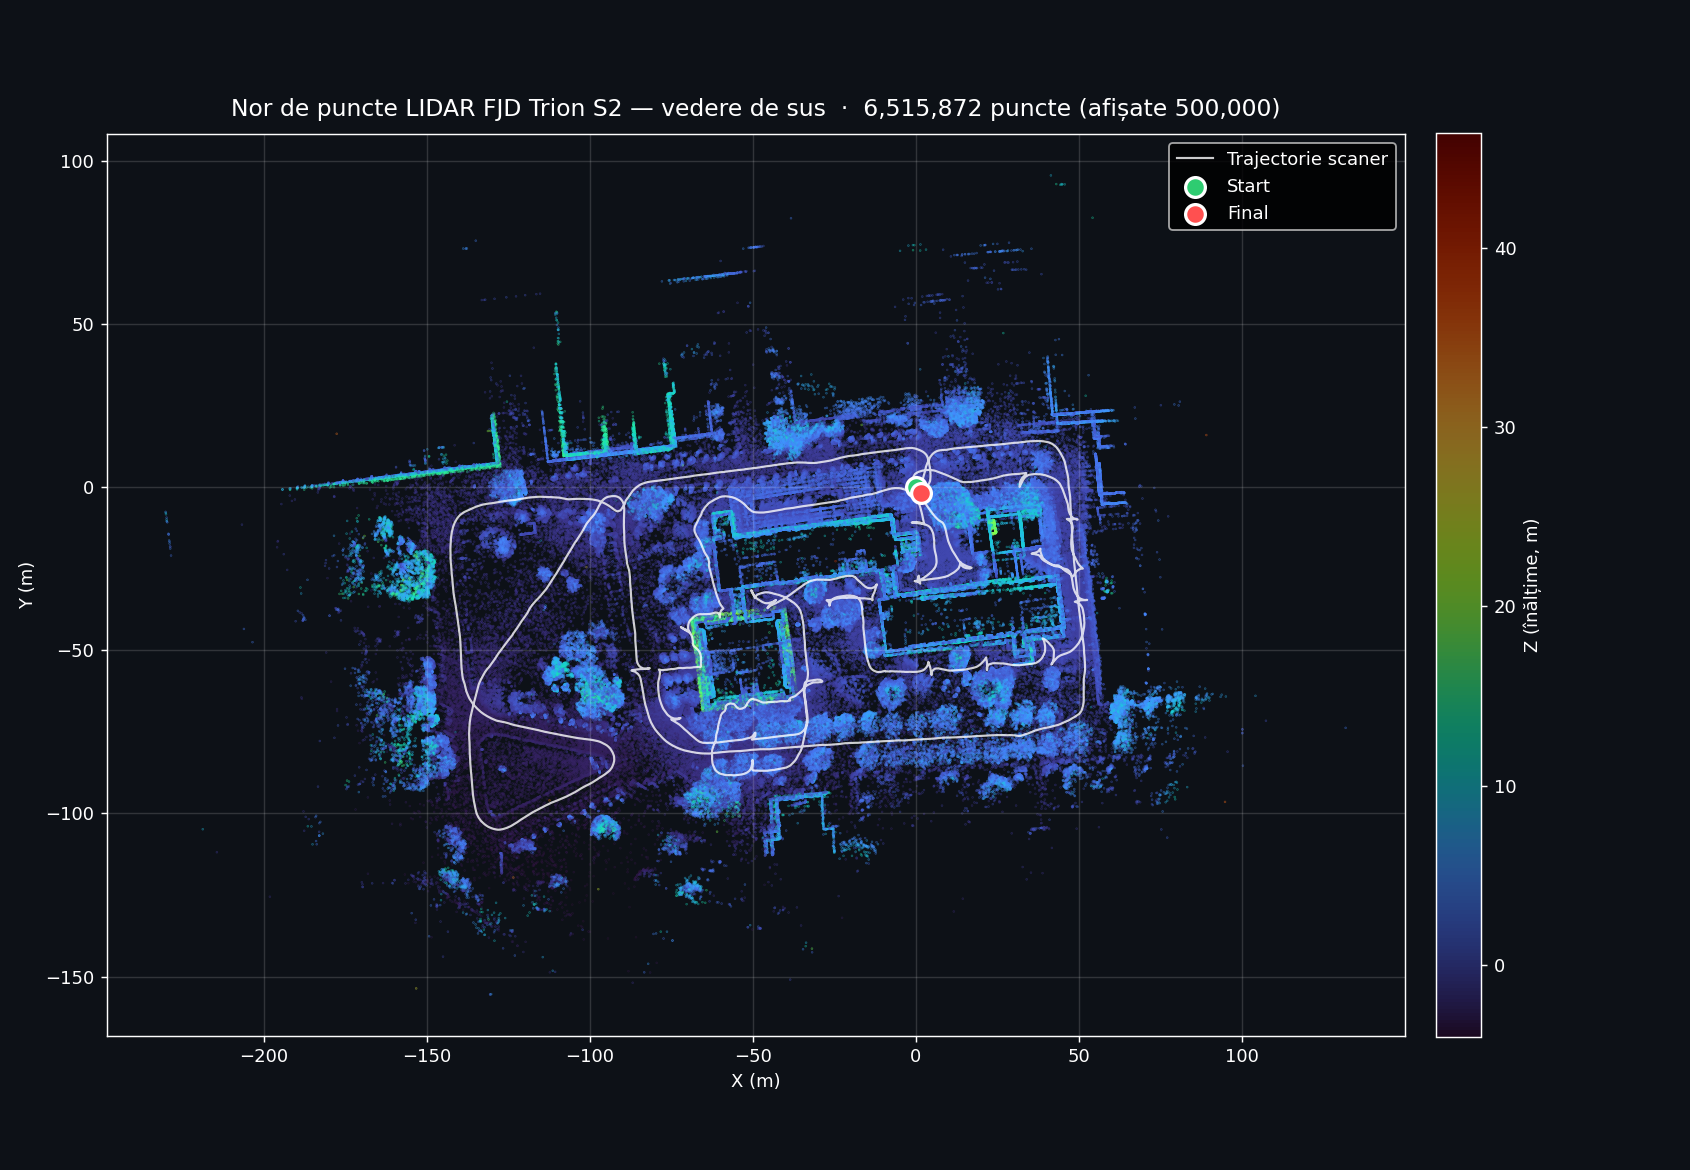
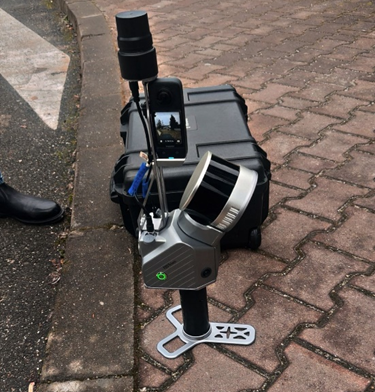
SLAM LiDARTerrestrial Acquisition — FJD Trion S2
Equipment specifications
| Weight | 2 kg (with battery) |
| LiDAR sensor | multi-line laser |
| Field of view | 360° × 270° |
| Range | up to 120 m (80% reflectivity) |
| Capture rate | 640.000 pts / s |
| Relative accuracy | up to 1.2 cm |
| Cameras | 2 × 12 MP panoramic |
| Positioning | SLAM + IMU + VIO + RTK / PPK |
| Operating mode | handheld, walking 0.5–1.0 m/s |
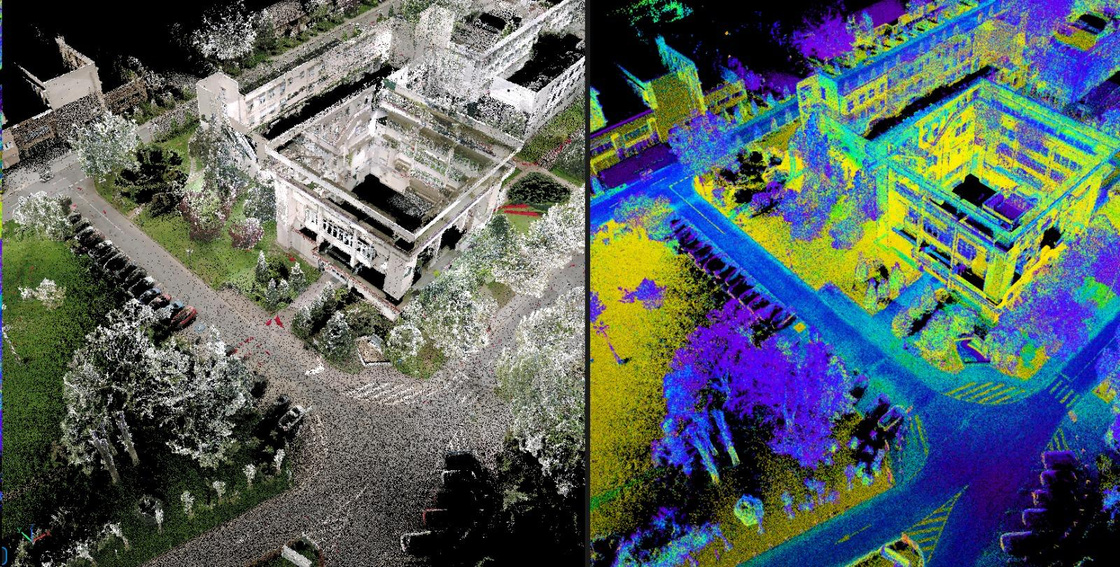
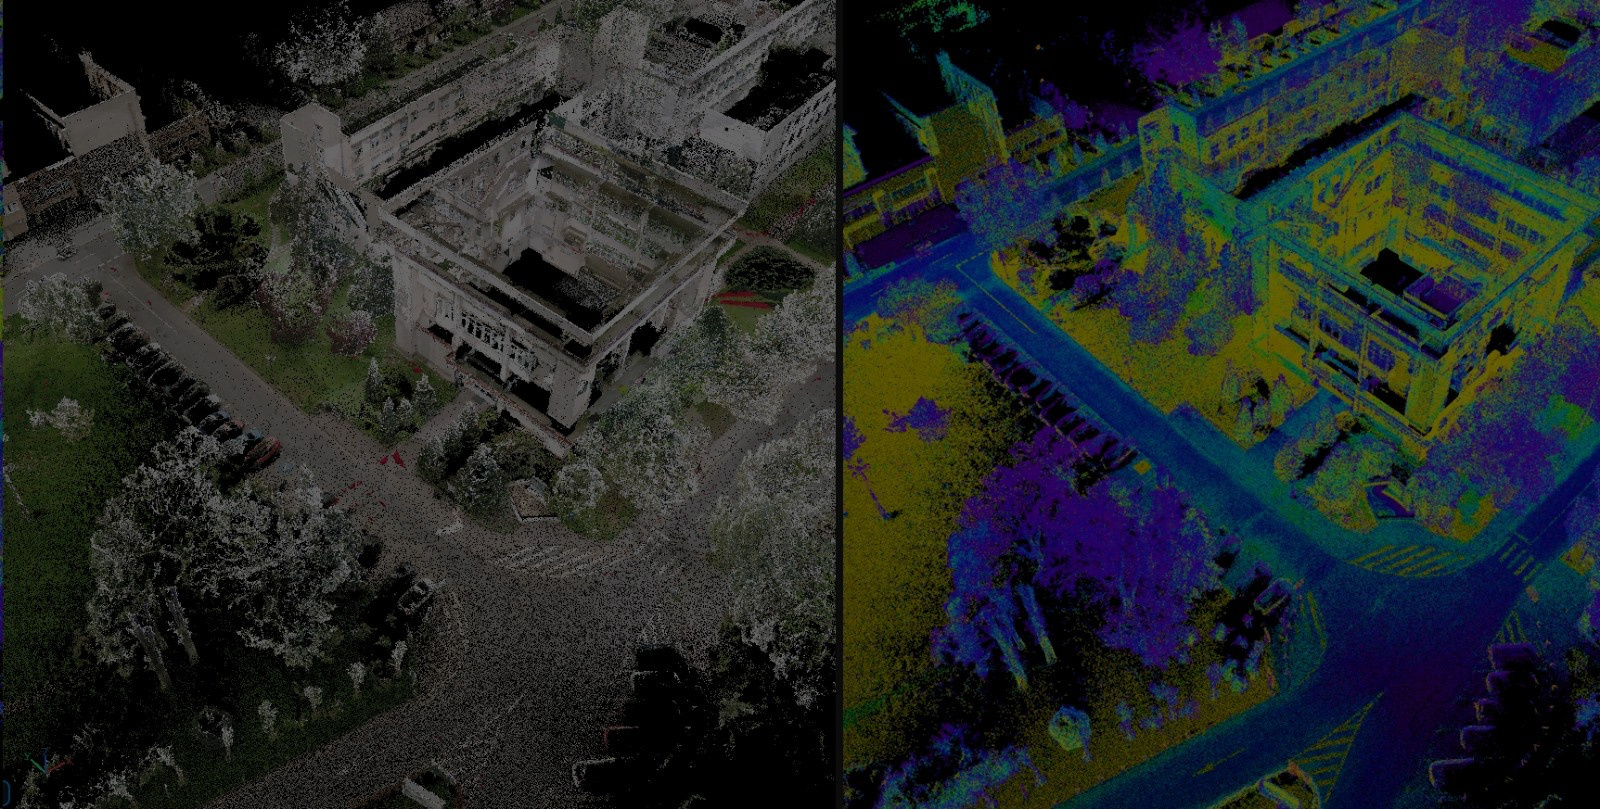
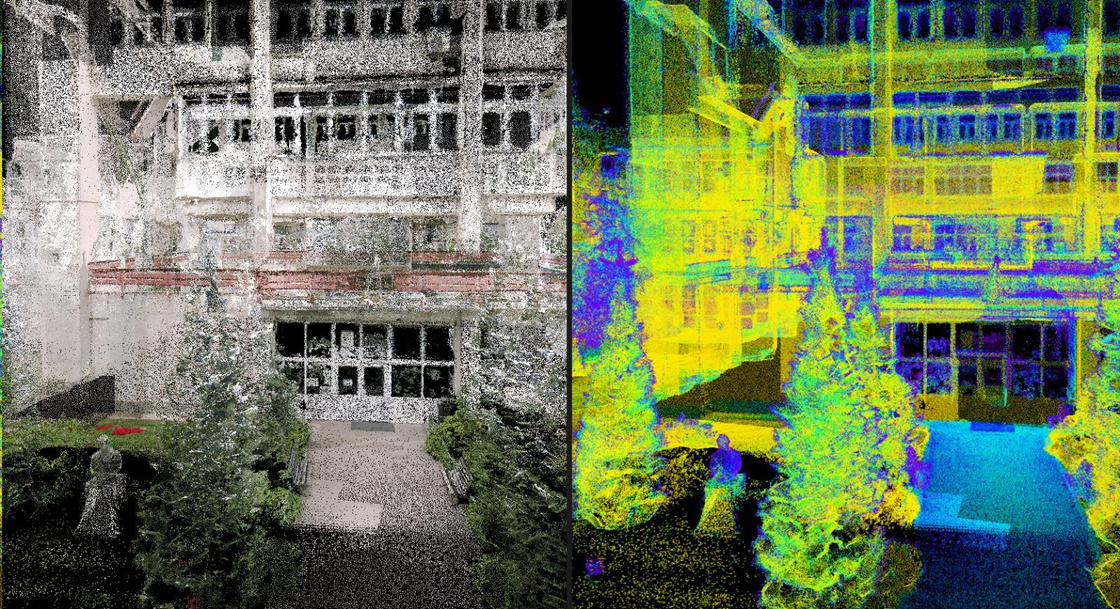
Visualization ModesPoint Cloud — RGB vs Intensity
Two complementary visualization modes derived from the unified point cloud — RGB (left of each pair) for visual realism, intensity (right) for material analysis.
Acquisition SoftwareFJD Trion Studio — Real-time Interface
During the campus scan, the FJD Trion Studio app on the device shows a live floor-plan view of the SLAM trajectory together with the dual fisheye camera feeds.
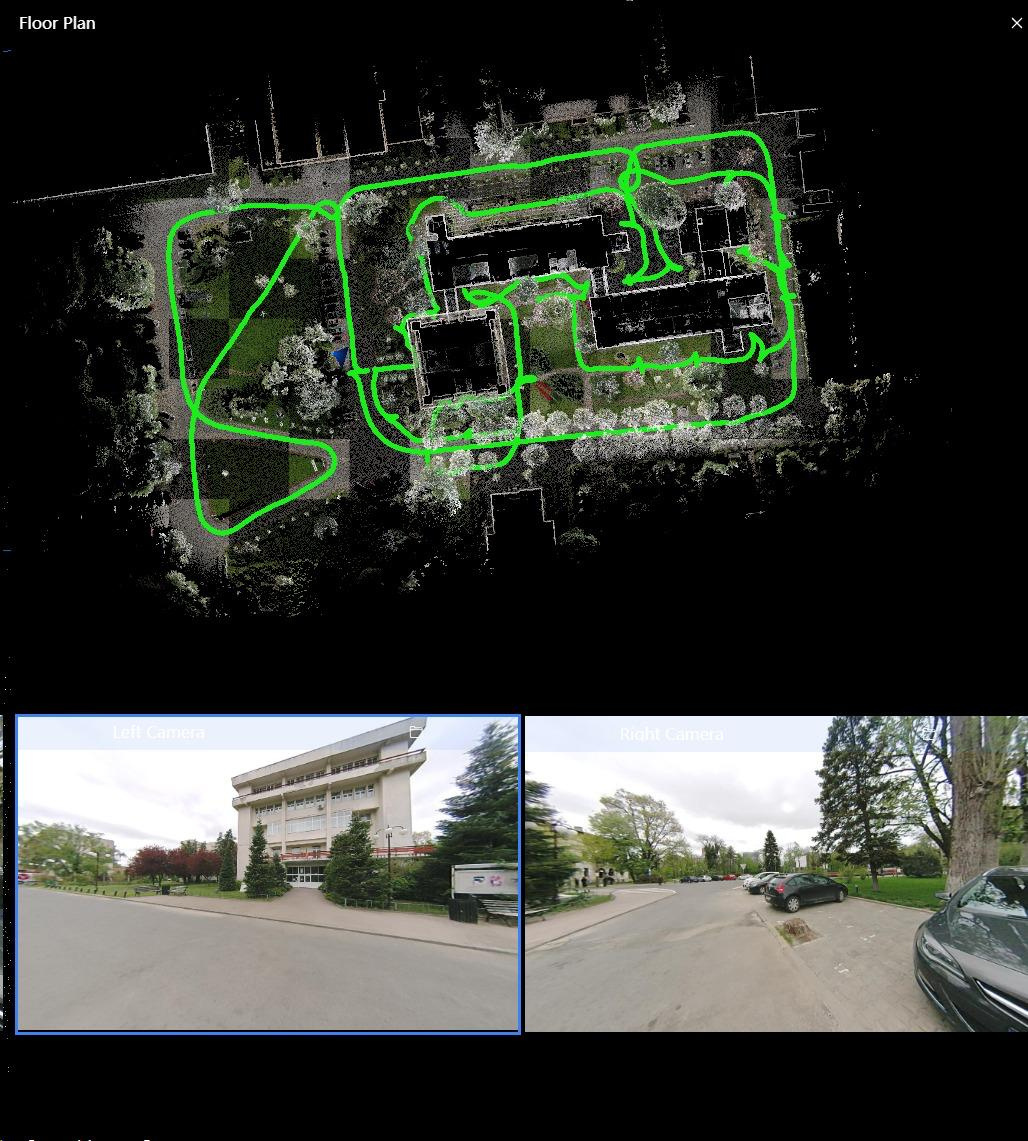
Interface features
- Real-time floor-plan view
- Live trajectory tracking (green path)
- Dual camera preview (Left + Right)
- On-site quality validation
- Loop closure indication
Live viewer · 2D mapInteractive Orthophoto
Geo-referenced orthophoto of the USAMV / FIFIM area, served on the UGA Aerial Point Cloud Hub.
Live viewer · 3D point cloudInteractive Point Cloud — Potree
Full LiDAR point cloud of the FIFIM Faculty viewable in any web browser. Includes measurement, sections, and georeferenced PNG export.
Economic ImpactCost & Time Efficiency
Equipment cost reduction
vs. high-end terrestrial laser scanners (Leica · FARO · Riegl)
Acquisition time reduction
vs. conventional total-station + static TLS workflow
Key takeawaysConclusions
FEASIBILITY
An accurate, scalable digital twin can be built in Romania with consumer-grade equipment.
COMPLEMENTARITY
Multi-sensor fusion (UAV + SLAM LiDAR) overcomes occlusion and coverage limits.
ADOPTABILITY
Methodology aligned with Nordic practices — directly transferable to Romanian institutional contexts.
Mobile · Live web viewersOpen the live data on your phone
Scan a QR code below to open the orthophoto map or the LiDAR point cloud directly in your phone's browser.
Orthophoto map
WebODM result · Stereo 70 (EPSG:3844)

drone.ugaerial.ro/Orto_-_Facultate_Fifim_-_Test.tif/map
LiDAR point cloud
Potree 3D viewer · UAV scan

drone.ugaerial.ro/LAZ_LIDAR_DRONA_FIFIM.las
FJD Trion S2 · Scan highlights Point cloud showcase — captured by FJD S2 scanner
Two short clips processed from the FJD Trion S2 scan: a quick walkthrough of the dense point cloud, and an automatic classification by elevation and intensity. Both clips loop continuously.
① Short presentation — dense point cloud walkthrough
A quick fly-through of the raw FJD Trion S2 point cloud captured around the FIFIM building. The camera orbits the dense, RGB-colored 3D reconstruction — you can read facade details, doors, and even individual trees. This is the unprocessed output straight after SLAM trajectory optimization and global registration. Duration: 16 seconds · auto-loops.
② Classification by elevation + intensity · with vectorized roads
The same point cloud is processed and automatically classified into semantic layers using elevation (ground vs above-ground vs canopy) and LiDAR intensity (asphalt vs vegetation vs building surfaces). Each class is rendered with a distinct color so ground, low vegetation, and structures are immediately visible.
On top of that, the road network was vectorized — the green polyline following the asphalt is a clean GIS-ready vector extracted from the classified cloud, ready for import into AutoCAD / QGIS / ArcGIS. Duration: 1 m 38 s · auto-loops.
BONUS · Our most recent experiment Our best approach — 3D Gaussian Splatting
Beyond the established LiDAR + photogrammetry pipeline, our team also explored a state-of-the-art neural rendering technique: 3D Gaussian Splatting (3DGS). From a small set of input photographs, 3DGS produces a photorealistic, fully navigable 3D scene in the browser — preserving real lighting, textures, and even reflections. The interactive scene below is hosted on superspl.at and can be explored directly in your browser.
Navigation · Mouse + Keyboard
Side toolbar (inside the viewer)
On mobile: one-finger drag = orbit · two-finger pinch = zoom · two-finger drag = pan.
Full LiDAR cloud · Potree Complete point cloud — interactive viewer
The full classified LiDAR point cloud captured on 7 February 2026, served via the Potree web viewer. Includes measurement, sectioning, and georeferenced PNG+PGW export tools.
Audience feedback · AnonymousRate this presentation
No account, no email — just one click. Each device can vote once.
How would you rate this presentation? Click a number from 1 (poor) to 10 (excellent).